almdrs
1
I haven’t figured out how to import the downloaded CSV file to create a graph showing sales by the month (quantity and value etc).
Is it possible to import the file into Google Sheets or another spreadsheet program?
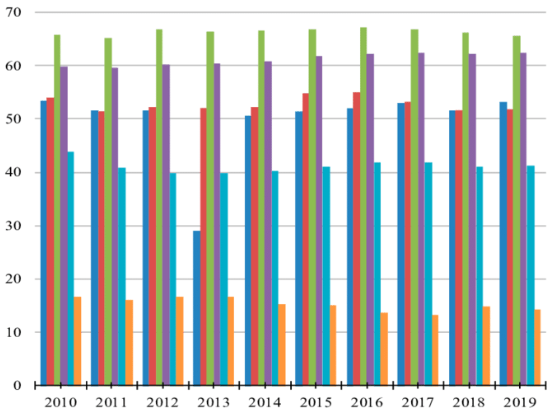
I’m trying to have something like this:
almdrs
2
The CSV file can be found on the Royalty History page in the earnings:
almdrs
4
Hello, Baylee.
No, I use Google Docs and LibreOffice Calc at home.
I’ll try to access a computer that has Excel installed and follow those instructions.
Thank you!
Idraw
5